Learn the ins and outs of analytics on Maestro.
Community
The community dashboard can be accessed directly from the admin toolbar on the left-hand side of your Maestro dashboard. It provides an aggregate of all users who have logged in.
You can filter the data based on "User with Entitlement" or "User who Purchased Entitlement" to see who has access to a particular ticket/subscription, and who has purchased them.
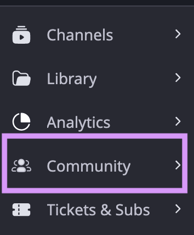
Users can be exported via CSV from the Community View.
You may also search for an individual user and directly manage, refund, and remove their Entitlements from this view.
Trends
The Trends tab is located under Analytics in the admin toolbar and can be used to display an overview of the traffic on your Maestro site.
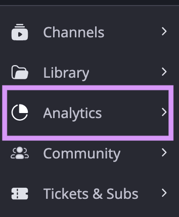
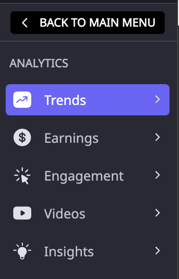
If you'd like to see the data for a specific time or event, select the timeframe on the top right. The tab defaults to the last 24 hours and is site-wide. However, you can set a custom time range and filter by channel as well.

Events (in Trends)
The Events tab can be found along the top within Trends and is used to create event reports within a specific time period. Simply create an event, set your date range, and generate your report.

Within the event report, you have the option to export the raw data or share the report via a link with a password.
Engagement (in Trends)
The Engagement tab is also found at the top within Trends and is used to break down user engagement (ex: views, clicks) for Panels, Overlays, Cards, and Quests.

You can also find information on any live raffle overlay winners in the overlays section. To view the data for a specific amount of time, enter the timeframe on the top left.
Videos
The Videos dashboard is located under Analytics in the admin toolbar and provides a detailed view of your videos, including the total time spent with each video as well as the play count for each video. You may filter based on a variety of data parameters.
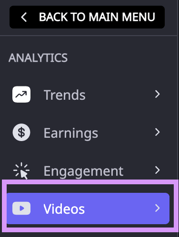
More info on the Videos Dashboard can be found here.
Earnings
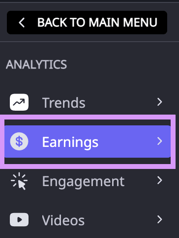
The Earnings dashboard is located under Analytics in the admin toolbar and provides a detailed view of your earnings based on the gross ticket price. You can see the highest-performing SKUs as well as filter based on a variety of data parameters.
More info on the Earnings Dashboard can be found here.
Have any more questions? Join our Discord server for more helpful tips and tricks.